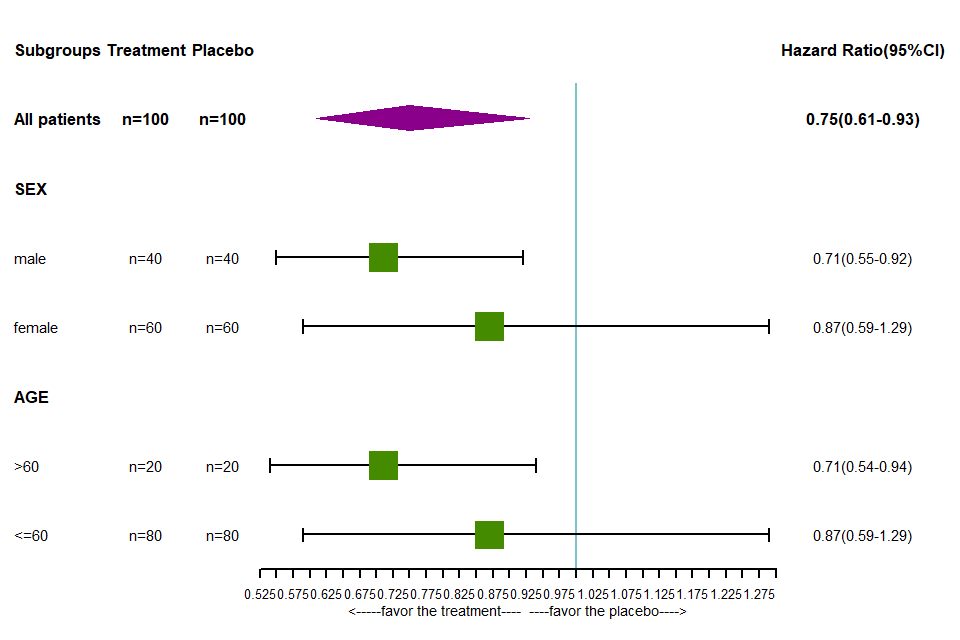
R 语言forestplot包画亚组分析的森林图
如何使用R绘制森林图?
数据结构如下,直接复制进入csv文件即可。
Subgroups | Treatment | Placebo | Hazard Ratio(95%CI) | |||
All patients | n=100 | n=100 | 0.75(0.61-0.93) | 0.75 | 0.61 | 0.93 |
SEX | ||||||
male | n=40 | n=40 | 0.71(0.55-0.92) | 0.71 | 0.55 | 0.92 |
female | n=60 | n=60 | 0.87(0.59-1.29) | 0.87 | 0.59 | 1.29 |
AGE | ||||||
>60 | n=20 | n=20 | 0.71(0.54-0.94) | 0.71 | 0.54 | 0.94 |
<=60 | n=80 | n=80 | 0.87(0.59-1.29) | 0.87 | 0.59 | 1.29 |
library(forestplot)
rs_forest  <- read.csv(file = "D:/data.csv",header = FALSE)
# 读入数据的时候一定要把header设置成FALSE,确保第一行不被当作列名称。
png("Forestplot.png",width=960,height = 640)
forestplot(labeltext = as.matrix(rs_forest[,1:4]),
#设置用于文本展示的列,此处我们用数据的前四列作为文本,在图中展示
mean = rs_forest$V5, #设置均值
lower = rs_forest$V6, #设置均值的lowlimits限
upper = rs_forest$V7, #设置均值的uplimits限
is.summary=c(T,T,T,F,F,T,F,F,T,F,F,T,F,F,F,T,F,F,T,F,F,T,F,F,T,F,F),
#该参数接受一个逻辑向量,用于定义数据中每一行是否是汇总值,若是,则在对应位置设置为TRUE,若否,则设置为FALSE;设置为TRUE的行则以粗体出现
zero = 1, #设置参照值,此处我们展示的是风险比,故参照值是1
boxsize = 0.4, #设置点估计的方形大小
lineheight = unit(8,'mm'),#设置图形中的行距
colgap = unit(2,'mm'),#设置图形中的列间距
lwd.zero = 2,#设置参考线的粗细
lwd.ci = 2,#设置区间估计线的粗细
col=fpColors(box='#458B00',summary="#8B008B",lines = 'black',zero = '#7AC5CD'),
#使用fpColors()函数定义图形元素的颜色,从左至右分别对应点估计方形,汇总值,区间估计线,参考线
xlab="<-----favor the treatment----  ----favor the placebo---->",#设置x轴标签
lwd.xaxis=2,#设置X轴线的粗细
lty.ci = "solid",
graph.pos = 4,
txt_gp=fpTxtGp(label=gpar(cex=1.25),ticks=gpar(cex=1.1),xlab=gpar(cex=1.2)))#设置森林图的位置,此处设置为4,则出现在第四列
dev.off()
然后打开此电脑文档即可找到刚才生成的PNG格式的森林图。如下所示:
 参考文献
参考文献
用R语言的forestplot包画亚组分析森林https://www.plob.org/article/22371.html

